Sunday, August 3, 2014

Final 1b: Class 8, Scratch Animated Greeting Card


This is an animated greeting card I created using Scratch.  This tool allowed me to animate and create both bitmap and vector graphics.  It is a final exercise from the Immersive Education course that I am taking at Boston College. This course is called Discovering Computer Graphics. For details, visit the immersive BC portal at http://ImmersiveEducation.org/@/bc

Process Screenshots:


Final 1a Class 8: Getting Started with Vector and Bitmap Graphics in Scratch

My Getting Started with Scratch Project

Process Screenshots:


Thursday, July 31, 2014

FINAL PROJECT: DECONSTRUCTION

Deleting my 5 favorite videos...

Deleting my 5 research papers...

Deleting the rest of the content...

cont...

These are screenshots of my deleting the remainder of all the research videos and content.  It is a final exercise from the Immersive Education course that I am taking at Boston College. This course is called Discovering Computer Graphics. For details, visit the immersive BC portal at http://ImmersiveEducation.org/@/bc


FINAL PROJECT: ADDING 10 NEW CONTENT ELEMENTS TO MY IMMERSIVE LIBRARY.

This is the entrance to my additional contents section of my virtual world.

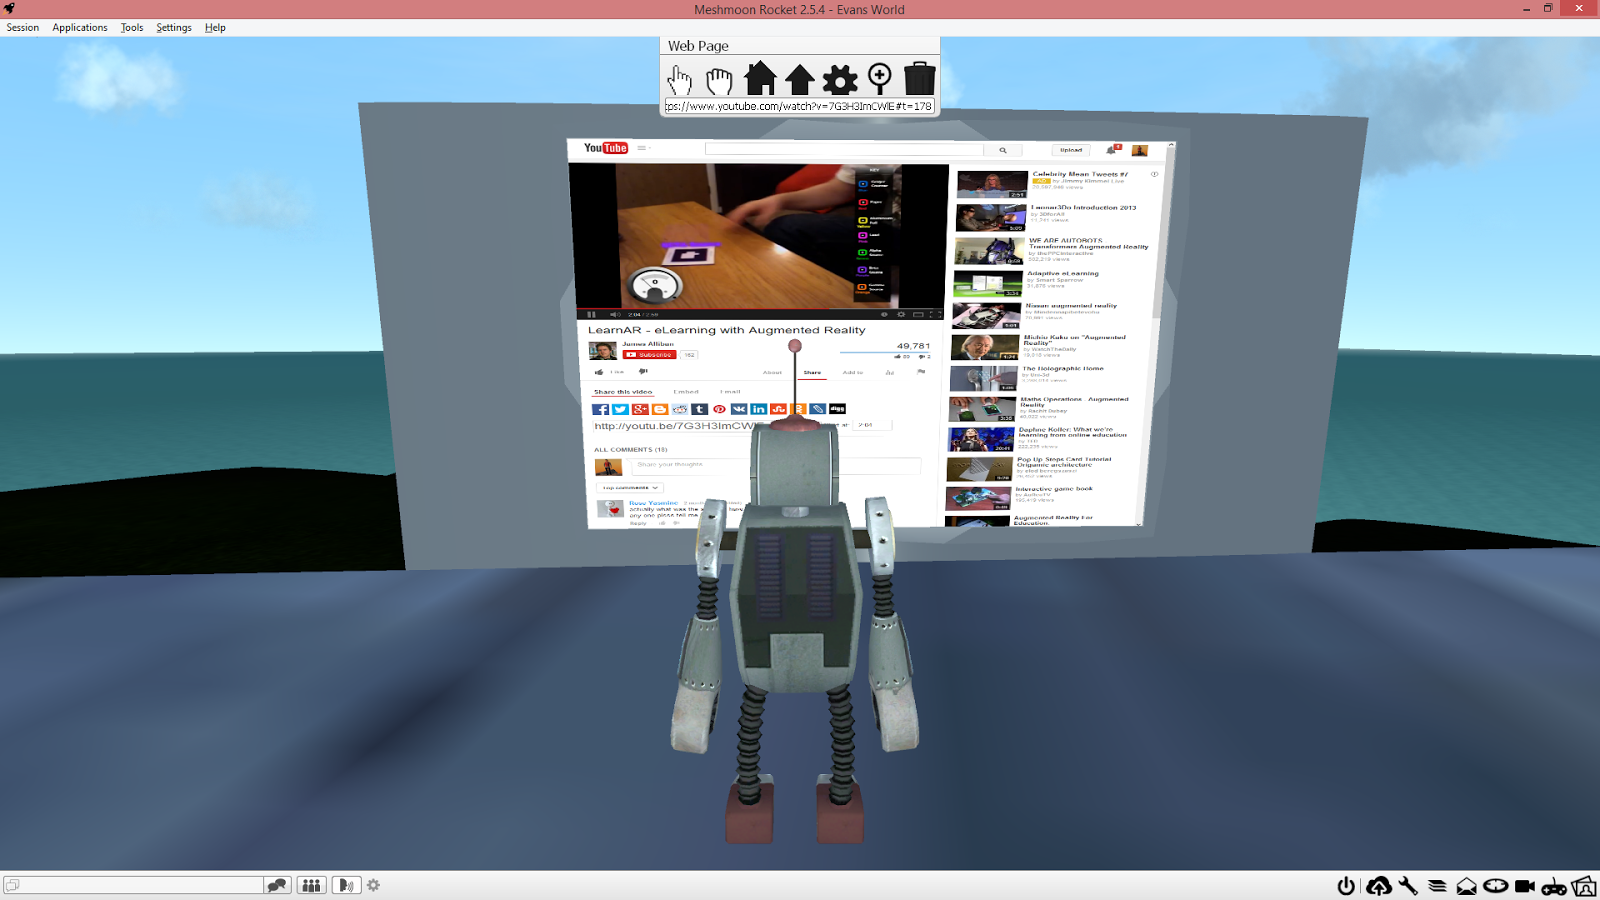
I've posted videos on more immersive education examples...

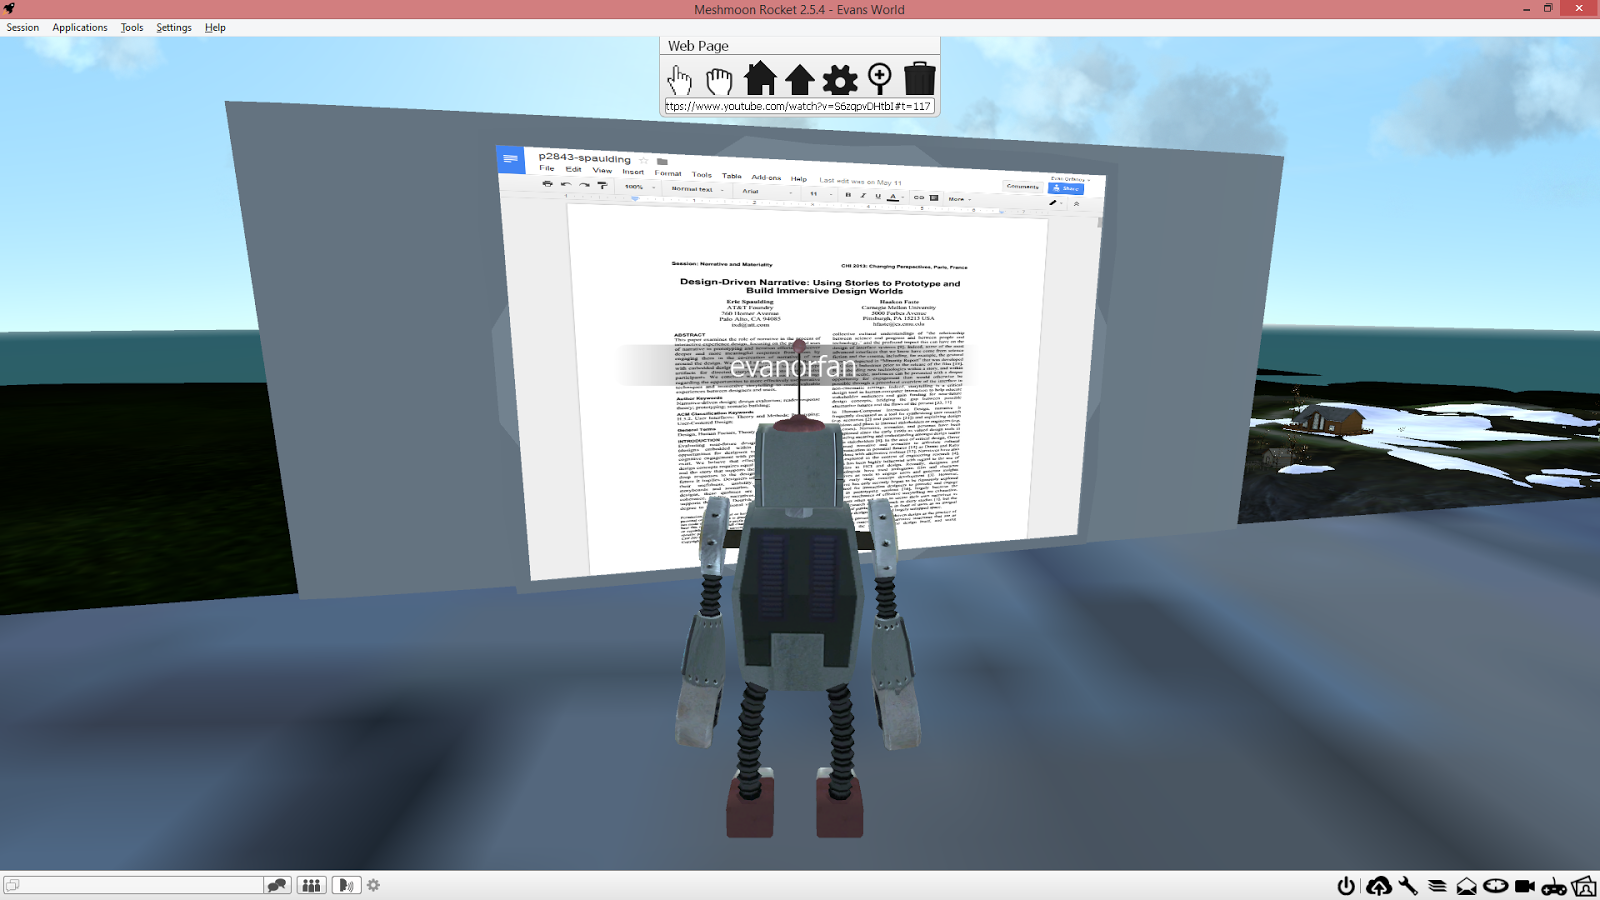
More research papers posted...

Some cool augmented reality learnings....

More in 3D modeling and use of 3D software...

Interesting news for the Immersive Education world...


A future where augmented reality is a part of every day life...

More interesting tools to help in immersion...

More research papers...

Interest 3D modeling software...

More research, and good to see more immersion in gaming...

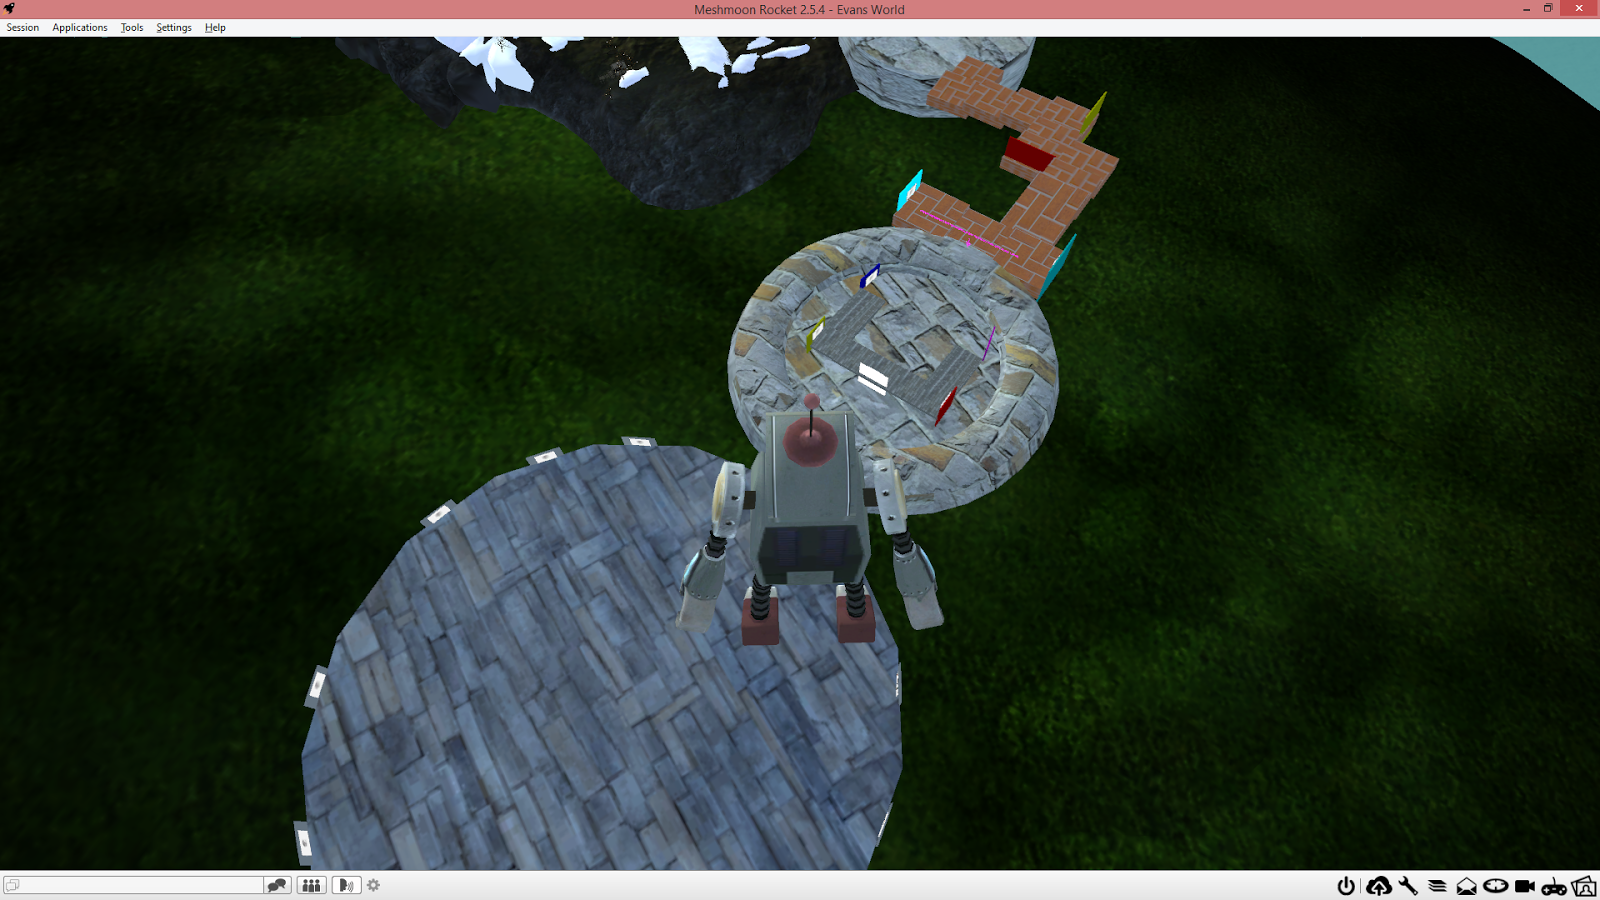
An aerial final view of this area.

These are screenshots of my virtual world I created in Meshmoon.  These screenshots are of the final 10 pieces of content (videos and papers). It is a final exercise from the Immersive Education course that I am taking at Boston College. This course is called Discovering Computer Graphics. For details, visit the immersive BC portal at http://ImmersiveEducation.org/@/bc

FINAL PROJECT: ADDING 5 PDF PAPERS TO MY IMMERSIVE LIBRARY

Added some 3D text to my entrance to help guide people to the right place.

Here I am having added my first PDF.

There was definitely plenty of moving and adjusting for some of the panels.

I uploaded my PDFs into my Google Drive...

...but I have to make sure the sharing properties allowed for those with the link to view...

...otherwise it would not have showed up correctly in the media import.

An aerial view of the 5 research paper area.

A frontal view.

These are screenshots of me in my virtual 3D library that I constructed in Meshmoon. This particular section holds 5 of my favorite PDFs that are research documents on immersion and 3D applications. It is a final exercise from the Immersive Education course that I am taking at Boston College. This course is called Discovering Computer Graphics. For details, visit the immersive BC portal at http://ImmersiveEducation.org/@/bc

FINAL PROJECT: TESTING MY FELLOW CLASSMATES' IMMERSIVE LIBRARIES

This is a screenshot of Rory's world, very cool how he posted his articles through a prim.

Another shot of Rory's world, this time in a building.

Look like Edward is making good progress in his world.

This is Cristina's world, very open layout.

This is Brian Conner's world, very cool how he wrapped the media around a sphere.

These are screenshots of me in my fellow classmate's virtual libraries giving everything a quick test. It is a final exercise from the Immersive Education course that I am taking at Boston College. This course is called Discovering Computer Graphics. For details, visit the immersive BC portal at http://ImmersiveEducation.org/@/bc

WebGL Chrome Experiments using Google's Chrome Browser


This is how the view starts out when you launch Asterank.  This serves as an interactive 3D visualization of the inner solar system.  The brightest dot is the sun and the blue ring is Earth's orbit.


For more details, there are a large amount of asteroids that you can see displayed in the visualization as well as a graph above.  The graph also hold data on the economic appraisals of space mining prospects.


This is the completely zoomed out view of what is a virtual snow globe of the North Pole.  You can see the snow formations at the top ready to drop.


Here is a zoomed in view of inside the virtual snow globe.  There are virtual Christmas trees of different sizes that luminate.  This screenshot was taken a couple minutes after the first, so the snow that was accumulated at the top is starting to show up at this level.


Another interactive space visualization but the focus here is on the known stars of the universe.  This goes as far as showing the real location of 100,000 stars.  This view is how it starts after you zoom in a considerable amount.


There is also a mini-animation that you can follow where you start one the Sun of our solar system, and it begins to zoom out further and further with explanations of what you are seeing.